High-load failures rarely start as a clean outage. They start as drift. Median latency stays stable while p95 climbs. Traces show more queue time. Connection pools begin to wait. One upstream call quietly grows into the longest span on the critical request path. By the time averages look alarming, user impact has already started, but only for part of the traffic.
This article focuses on the mechanics of high-load behavior in real systems and the engineering patterns that keep it under control. It covers how to observe tail latency, identify where contention and waiting originate, classify common failure shapes, and apply proven controls – limits, isolation, caching, and time budgets – that make services predictable under load.

High-load is not a single traffic number
Many teams describe high-load as more requests per second. That view misses the problem that hurts users first. Under high-load, systems often fail through unpredictability, not through a single breaking point.
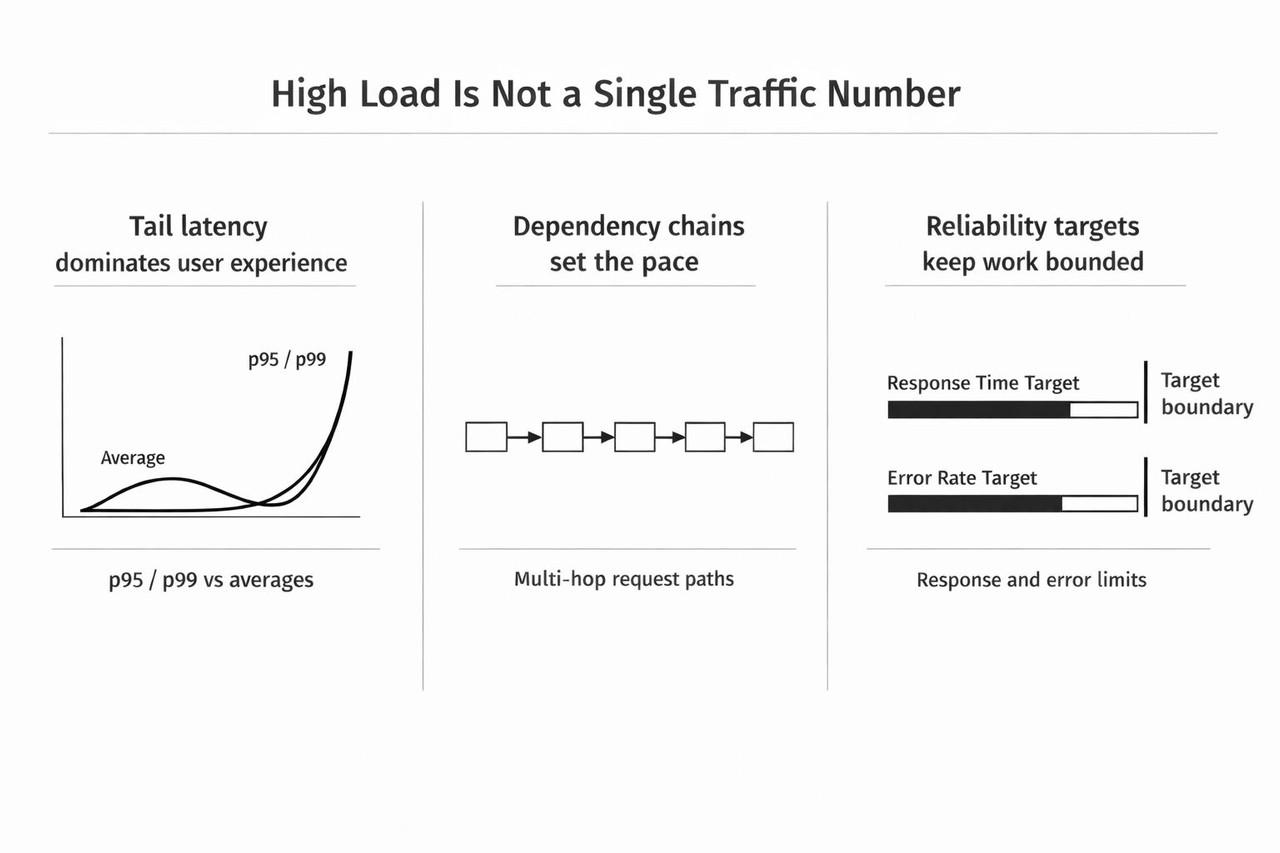
Three properties define high-load in practice:
- Tail latency dominates user experience. p95 and p99 reveal contention, cold-cache behavior, saturated pools, lock waits, and dependency variance that averages hide.
- Dependency chains set the pace. Most requests traverse multiple hops across internal services, caches, databases, queues, and external APIs. One slow hop can define the full request time.
- Reliability targets keep work bounded. Define explicit targets for response time and error rate on key flows. Targets prevent endless tuning and clarify what good enough means.
Start with measurement, not architecture
A rewrite feels decisive. Under high-load, rewrites often move the bottleneck or add new failure modes. A faster path is visibility that narrows the problem to a specific wait, a specific span, and a specific resource.
A practical baseline for every high-impact flow:
- Latency distribution by endpoint: p50, p95, p99, plus error rate.
- Saturation signals: pool wait time, queue depth, worker backlog, and in-flight requests.
- End-to-end tracing with useful spans: dependency calls, internal hops, and explicit waiting time.
- Dependency health by endpoint: timeouts, 429 responses, transient 5xx responses, and retry volume.
A simple triage shortcut helps early. If p95 rises while CPU stays flat, waiting is often the driver. The next suspects are pools, queues, locks, and upstream latency, not code that suddenly became slower overnight.
How to read a slow request end-to-end
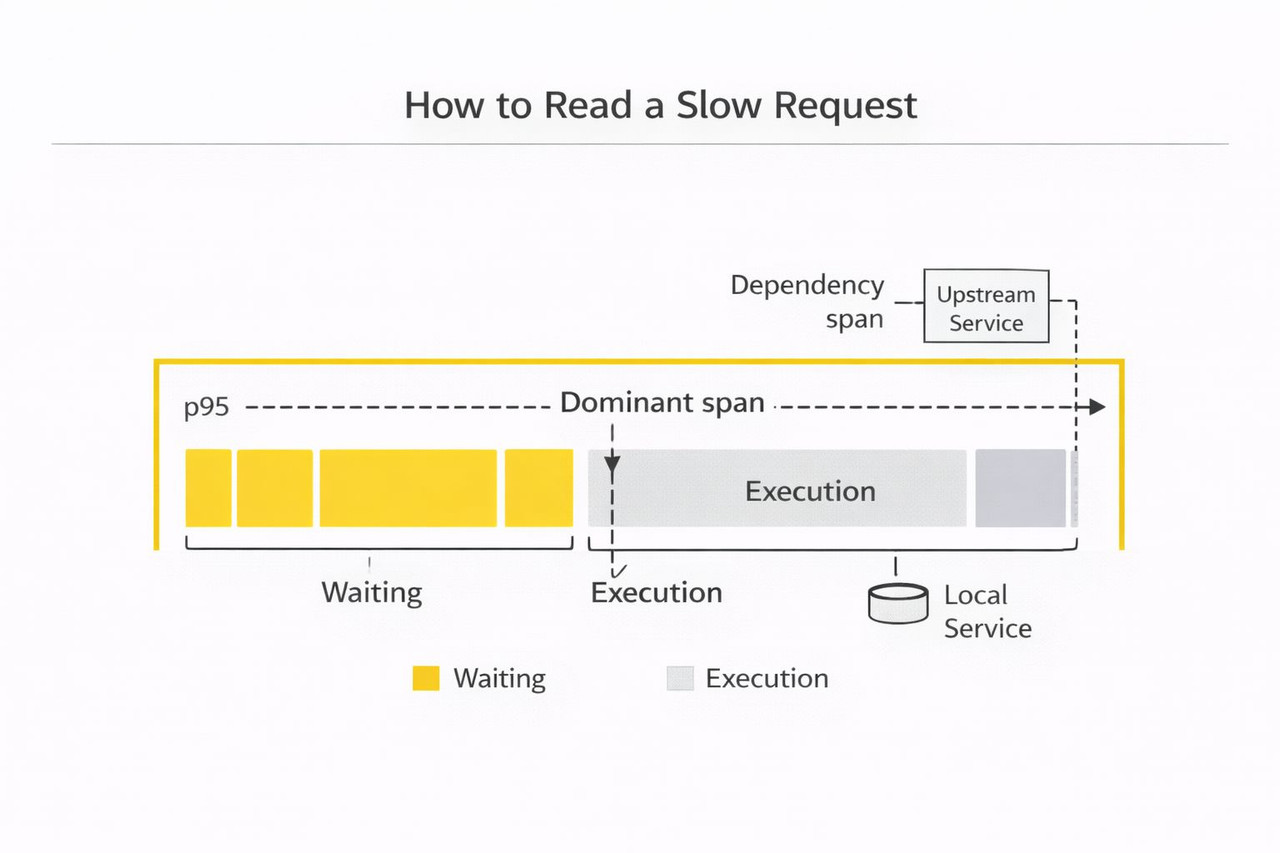
Dashboards help you spot the problem and its scope, when it started, which endpoints are affected, and which metrics moved, like p95, error rate, pool wait, queue depth, retries. Traces tell you why a request got slow by showing one request end-to-end, the exact call path, and whether time was spent doing work or waiting for a resource. A simple way to use traces is to compare one p50 request and one p95 request for the same endpoint and look for the difference in shape. If the slow trace shows a long wait before a DB call starts, the bottleneck is often connection acquisition or another pool limit. If the same path exists but one upstream span inflates, dependency variance, rate limiting, or retries usually drive the tail.
A repeatable approach:
- Pick one business-critical flow.
- Pull a representative slow trace around p95.
- Identify the dominant span, the one that consumes most of the latency budget.
- Decide whether the dependency is slow, or the service is waiting before the call starts.
- If there is waiting, name the limiting resource: a DB pool, an HTTP client pool, a worker queue, a lock, a thread pool, or an upstream rate limit.

Then confirm with metrics:
- If upstream spans grow, verify dependency latency histograms, timeout rate, 429 rate, error codes, and retry volume for the specific upstream endpoint.
- If queueing appears before calls, check pool sizes, backlog growth, and concurrency limits.
Unbounded concurrency is a classic trap. It looks like higher throughput, but under variance it creates more in-flight work, saturates pools, and turns delay into queue time.
Two incident shapes worth recognizing early
Many high-load incidents repeat the same internal structure.
- Dependency-variance cascade
An upstream becomes slightly slower. In-flight work rises. Pools saturate. Queue time grows. Tail latency spikes. Errors follow as timeouts arrive earlier than recovery.
Focus fixes on control and isolation: concurrency limits, time budgets, fail-fast behavior, and retry discipline. - Cache-miss spike and stampede
A hot-key expires or caching behavior changes after a deployment. Cache hit-rate drops. Many requests recompute the same expensive result. Downstream load spikes. Databases or external providers slow. Tail latency jumps. Retries add pressure.
Focus fixes on stampede protection: request coalescing, controlled refresh of hot keys, and explicit invalidation rules that avoid synchronized expiry.
Correct classification saves time. The wrong fix wastes time and increases risk during the next spike.
An optimization ladder that holds in production
Start with the safest, highest-leverage moves. Go deeper only when the limiting layer is proven.
- Reduce work on the request path. Remove redundant calls, batch chatty fan-outs, move non-critical work off the synchronous path, and add backpressure during dependency slowdowns. If a request writes to the database and also needs to publish an event, use the transactional outbox pattern, write the event into an outbox table in the same DB transaction, then publish to the queue asynchronously.
- Add caching with guardrails. Define keys, TTLs, and invalidation. Prevent stampedes with request coalescing and controlled refresh. Consider negative caching for repeated misses when it is safe.
- Simplify call patterns and service boundaries. Reduce unnecessary round-trips, shrink payloads on frequent calls, remove chatty internal loops, and keep hot interfaces stable.
- Fix data access with evidence. Use query plans and slow-query logs. Monitor index selectivity, plan stability, lock waits, and connection-pool wait time. Remove N+1 patterns on hot endpoints.
- Tune runtime last. Profile hot paths, allocation hotspots, and serialization overhead. Avoid blocking operations on high-concurrency routes. Tune DB pools, HTTP client pools, and worker concurrency deliberately.
Third-party integrations define predictability
Third-party APIs are frequent reasons of tail latency and incidents. They do not need to be down. Variance is enough.
Design integrations for predictable behavior:
- Timeout limits. Set per-call timeouts aligned to the overall request deadline. Long timeouts hide failure and increase queueing. Short timeouts can trigger retry storms.
- Retries. Treat retries as load multipliers. Cap retry count, use exponential backoff with jitter, and retry only likely transient errors. Use idempotency protections for operations with side-effects.
- Circuit-breakers and isolation. Circuit-breakers fail fast when an upstream degrades. Bulkheads isolate shared resources so one dependency cannot exhaust global pools for the entire service.
- Fallbacks. When product rules allow, cached responses, partial responses, or degraded views keep core flows usable during upstream instability.
- Observability. Track rate, errors, and duration per provider endpoint. Propagate trace context. Keep structured logs with correlation IDs.
- Templates. Use templated integration flows to standardize timeouts, retries, circuit-breakers, tracing, metrics, and log fields across teams.
Clear API contracts reduce performance surprises
Contract-first development improves more than integration speed. Clear contracts force explicit decisions about payload shape, pagination, error semantics, and timeouts. They reduce accidental chatty interactions and make changes safer across service boundaries. Contracts do not replace reliability targets, but they make ownership and diagnostics clearer when tracing points to a slow hop.
A note from clinical AI pipelines
High-stakes clinical workflows show a practical truth about latency. When response times become unpredictable, users fall back to manual steps. The system still functions, but it stops delivering value at the point of use. The same rule applies outside healthcare. Predictability often matters more than peak throughput.
What to do next sprint
If the goal is progress without a rewrite, focus on visibility, waiting, and defaults.
- Track p95 and p99 on top flows, plus error rate and dependency timeouts.
- Ensure traces show dominant spans and separate work time from waiting time.
- Correlate tail latency with saturation signals: pool wait time, queue depth, and in-flight requests.
- Add stampede protection for hot cached keys and high-traffic pages.
- Standardize integration defaults through templates: timeout budgets, capped retries with jitter, circuit-breakers, and consistent metrics and logs.
High-load performance is not a single breakthrough. It is a set of defaults and practices that keeps services stable when traffic spikes, dependencies drift, and edge cases arrive first.


