For those involved in the field of DevOps and cloud computing, where new techniques are constantly being developed to ensure continuous delivery and optimization of services, the main aim is the pursuit of seamless scalability and effective performance tuning.
Acknowledging this problem, in this article, I aim to deeply explore the core concepts of modern software engineering strategies and present an actionable way to surpass regular stumbling blocks that Software Engineers, Site Reliability Engineers, and DevOps practitioners might face.
This article is a direct result of the thoughts I shared at a recent talk with the same title, where I dissected how Python and its extensive ecosystem could transform AWS DevOps practices.
Scaling an application to accommodate varying traffic patterns without worsening performance or efficiency is a hard task. The difficulty presents itself in the act of scaling, but not only that. It lies also in the meticulous testing required, especially in production environments. It involves a deep understanding of potential bottlenecks and devising strategies to mitigate them without incurring prohibitive costs.
Traditional approaches often need to be revised with a more nuanced and sophisticated toolkit.


The Toolkit
Enter Python, a versatile language at the forefront of this transformation, is equipped with tools designed to fine-tune services to near perfection. In this work, I introduce you to a selected arsenal of Python tools tailored for AWS DevOps tasks.
Pandas: An indispensable library for data manipulation, enabling detailed analysis and insights into application performance and user behavior.
Jupyter: A notebook environment that facilitates the exploration and sharing of live code, equations, visualizations, and narrative text, making experimentation and documentation seamless.
Locust: An open-source load testing tool, crucial for simulating traffic and identifying scalability issues in a controlled manner.
boto3: The AWS SDK for Python, providing direct access to AWS services, allowing for automated infrastructure management and deployment.
The Context and Chosen Approach
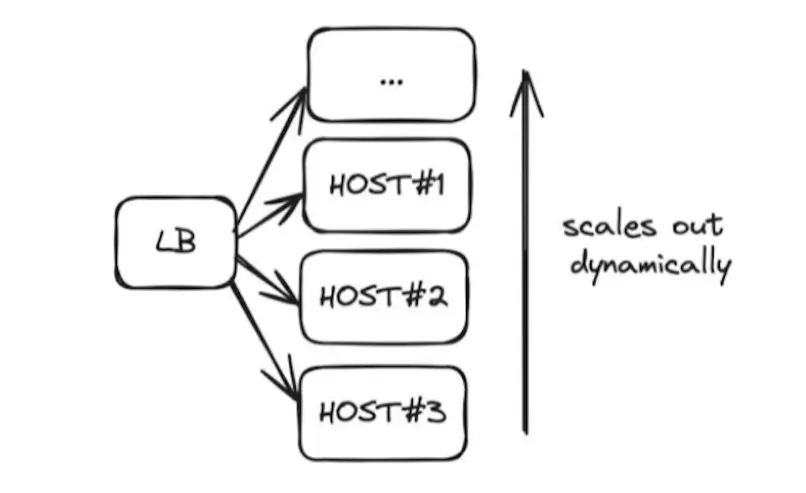
Now, let’s think of a standard situation when a service is capable of expanding across a range of nodes at an unpredictable scale in correspondence to traffic load. The right scaling—or out-scaling— strategy implies that you need to incorporate additional independent units into your system as and when you need capacity, this kind of being true scaling, where the system size automatically grows or shrinks to meet the demand. But how can one attain this kind of scale without affecting the balance between costs and benefits?
And also while ensuring that such expansion does not result in resource exhaustion, disruption, or any other form of unmanageable fallout? This is the essence of our problem that we seek to solve by using Python with a bit of machine learning fairy dust thrown in for good measure.
Setting the Stage
Imagine a scenario where the traffic to your service suddenly spikes, jumping from a few dozen requests per minute to a staggering 140,000 requests per minute. This kind of dramatic increase is common during major retail or e-commerce events like Black Friday or promotional sales, pushing infrastructure to its limits. While we often plan for these surges, sometimes, they catch us off guard, leaving our systems unprepared for the onslaught.
Addressing the challenge of scaling your service to manage this level of traffic is the core problem I aim to tackle using Python and machine learning techniques.
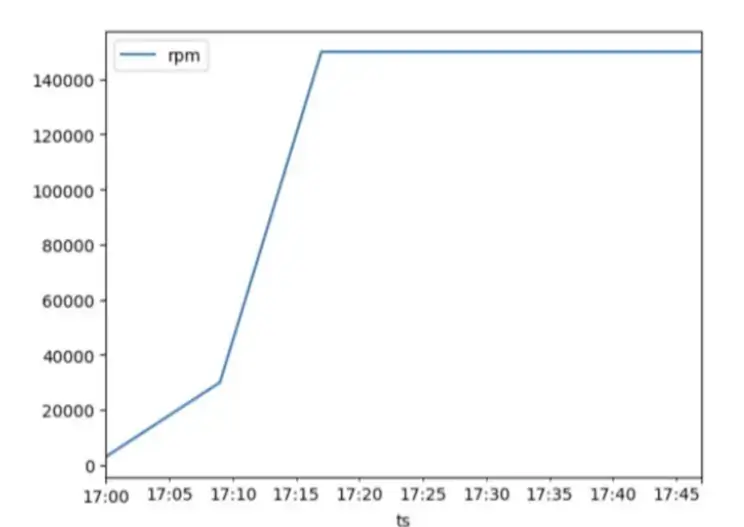
Our journey kicks off with a Python application running on AWS Elastic Beanstalk with an Application Load Balancer and EC2 t3.micro instances in play. This setup was chosen for its simplicity in testing, refining our scaling approach under controlled circumstances. In our experiment, I’ve set the scaling policy to adjust by one host based on CPU usage thresholds of 25% for scaling up and 15% for scaling down.
The Strategy
I. Load test one host :Our methodology involves a series of steps beginning with a load test to gauge how a single host handles traffic using Locust.io.
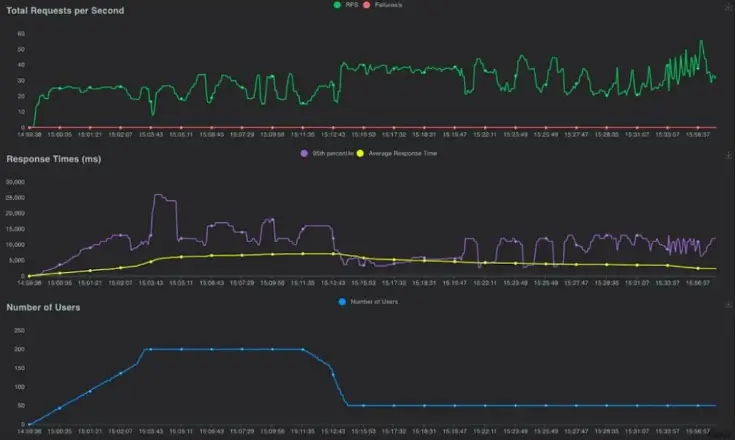
This initial test establishes a baseline capacity for one host which is crucial for predicting how a cluster may perform and scale under loads.
II. Retrieve data from AWS to Pandas
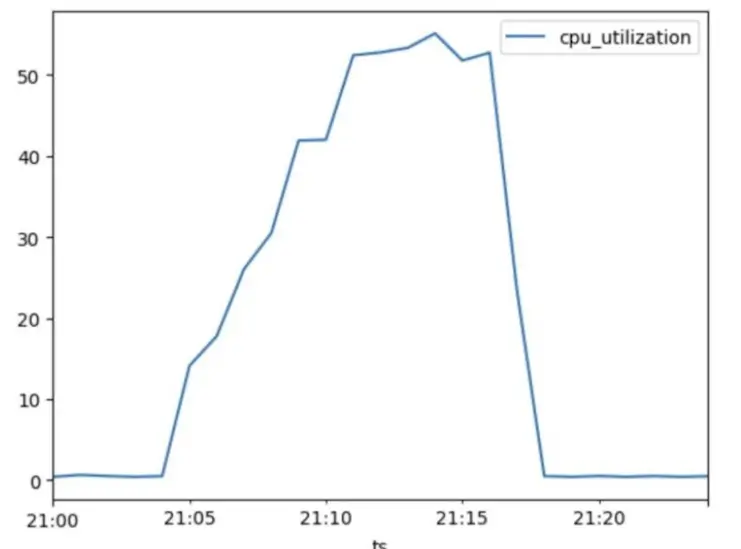
Data collection is key to our analysis. I extracted AWS CloudWatch metrics into Pandas and used this data manipulation tool to visualize and analyze our infrastructure’s behavior. This process uncovers a link between CPU usage and requests per minute, providing insights into predicting CPU load based on incoming traffic volume.
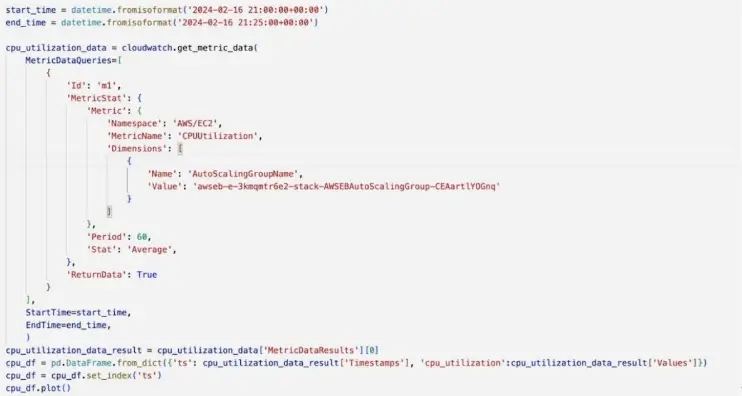
Pro-tip from me: Consider exporting your data to a CSV file. This step is crucial because CloudWatch data is being erased after a certain period.
Furthermore, using Pandas, I created graphs that offer a visual interpretation of our data, unlocking a level of sophistication and detail that is truly impressive. This powerful tool allows me to access and manipulate vast datasets further laying the groundwork for insightful analysis.
III. Determine one host capacity
One of the main aspects of our approach is determining the single host capacity. We can then make projections on a cluster’s reaction to growing volumes of incoming traffic and correctly scale it on this basis.
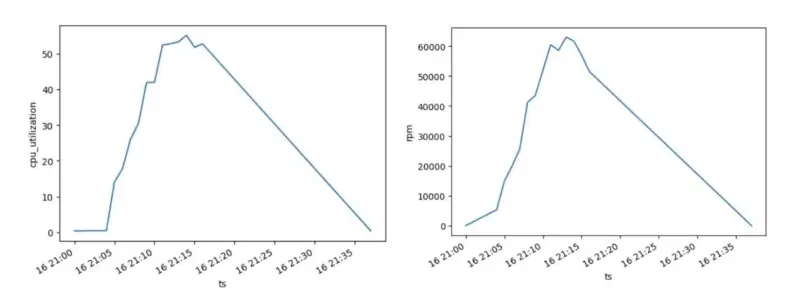
Nevertheless, it is not our aim to stop at these – we keep open to the possibility of even better results.
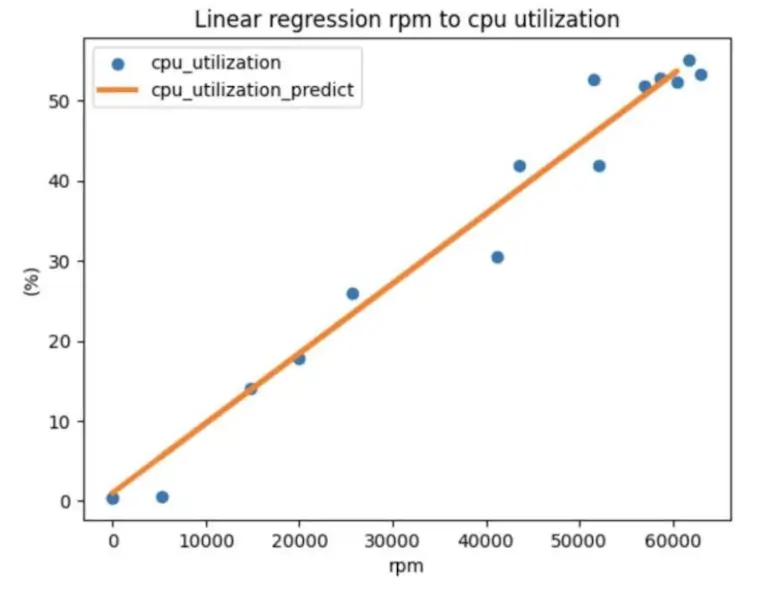
Out of the resulting findings, I extracted a few meaningful takeaways. I found a direct relationship between CPU RPMs and CPU utilization in the manner shown by a CPU average regression coefficient (cpu_avg_coef) of 0.0008967. This relation means that we can assume that with the speed 40,000 RPM CPU utilization will be no more than 35%.
The findings here are important as they curb the guesswork, and we are now in a position to predict CPU utilization based on the number of requests per minute. This predictive capability raises an important question: Do we have a single straight line here all the time? Our scaling strategy could be impacted if incoming traffic was not anything in the way of a linear pattern and there might be an added problem.
Hence, we are not only analyzing data but also systematically informing and validating the predictability and reliability of our traffic scaling framework under various traffic conditions.

Ultimately, How Can We Scale?
Keeping CPU utilization under the critical 50% threshold ensures the system operates within safe limits and prevents service disruptions. To achieve this, we would require a smart configuration of autoscaling parameters and a keen understanding of the system’s capacity.
Efficiency in scaling is achieved by utilizing AWS autoscaling to its fullest potential, which involves determining the most effective settings that allow for the highest possible CPU utilization without compromising system performance. The question then becomes: How can we configure autoscaling to meet these criteria?
Approaches
Testing in Production
If you conduct the tests directly in the production environment, you will be able to have real-world insights, but this is paired with very large risks, and you will need to put a lot of effort into production (usually during the times with the lowest traffic to not affect the customers).
Local Experimentation
Alternatively, hands-on testing of prototypes made in Python in the local area may give us the chance to manage risks and pinpoint scaling approaches with more precision. The proportion simulator and the empirical method for traffic relevance provide much-needed aid in the process.
So, I would recommend creating the scaling simulator, which I will demonstrate further. All the code presented you can find here: https://github.com/gustavoamigo/conf42-python-24.

Create a traffic shape generator:
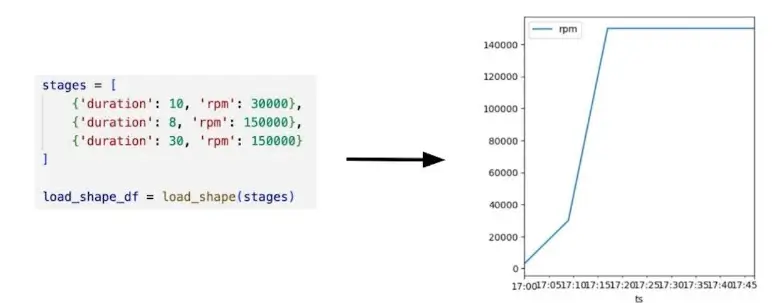
And run the first local experiment:
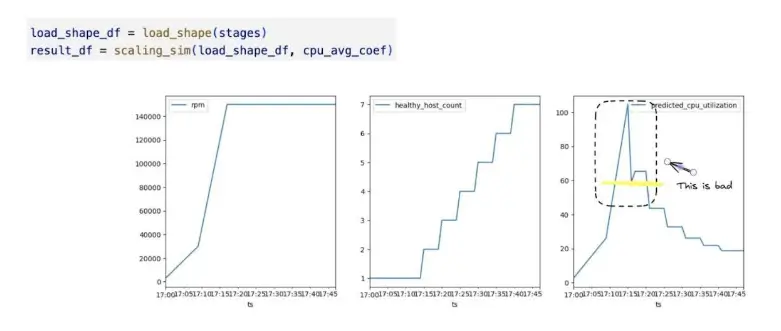
As you can see, in a practical test, we observed CPU utilization exceed the 50% mark during a simulated traffic surge, leading to service downtime. This situation highlighted the inadequacy of our initial scaling parameters, necessitating a reevaluation.
Refining the Scaling Strategy
First Attempt to Fix
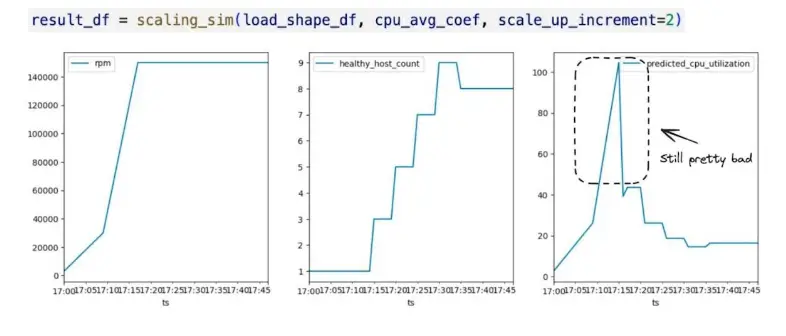
Changing the scale-up increment from 1 to 2 was of some benefit yet still did not fully resolve this issue, which could be seen in most discriminating cases when the reactive measures in production are employed, but the issue remains untouched due to the lack of effective solutions.

Identifying Optimal Parameters
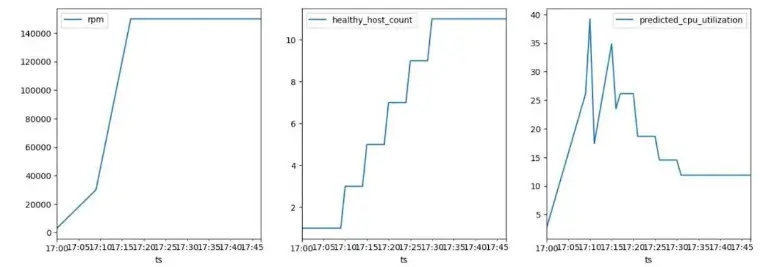
Through more experimenting, I found the mean of CPU utilization, the upper limit, and the growth rate increment to be the range that maintained the system patchwork below 50%, even during very busy times. The winner is:

Real-World Validation
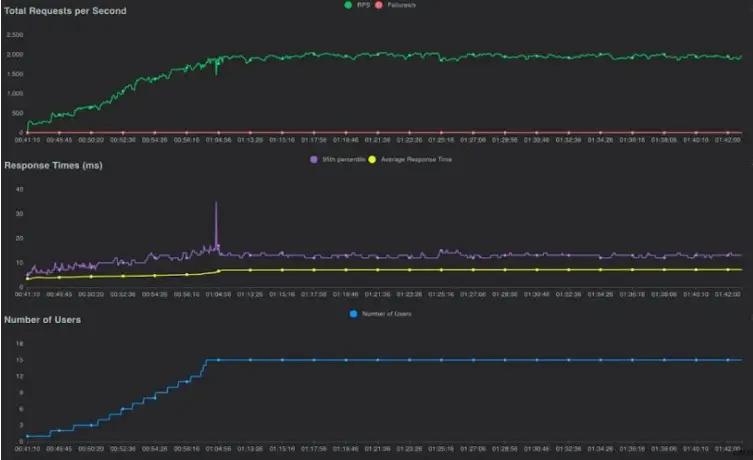
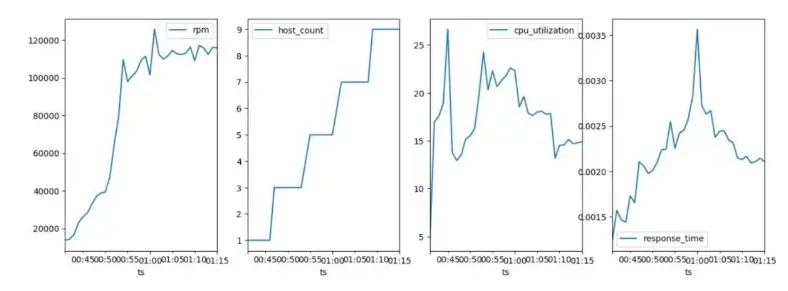
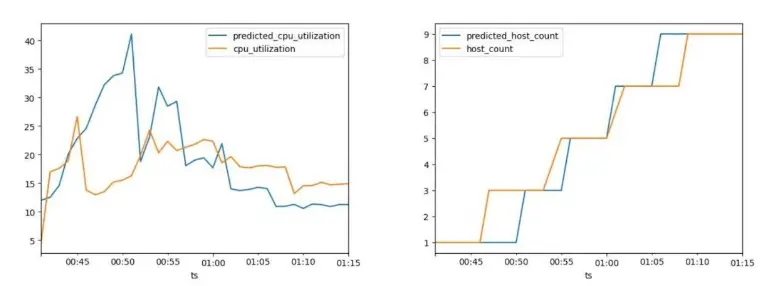
esting the new parameters in a live environment with up to 120,000 rpm confirmed the effectiveness of my approach. By adding hosts in increments of two, I kept CPU utilization below 39%, ensuring stable response times and no service interruptions.
Conclusion
The success story of going from initial challenges followed by a scaling strategy is nothing but highlighting the necessity of multiple testing and corrections. The transition happens as a result of setting the upper bound to 15% and increasing the exponential scale-up with each observation (as simulations have shown and experience inherently reveals.)
Here, the case study shows not only techniques on how to use Python and AWS autoscaling to resolve complicated scaling issues but also the worth of a data-driven DevOps.


